Eigenvalues as Measures of Instability in Financial Markets
Students of mathematics (like me) may initially find great difficulty in understanding Vectors, Matrices, Eigenvectors and Eigenvalues. A good way to understand them is to visualize. So in the 3-Dimensional chart above is a chart with an example of what Principal Component Analysis looks like. (The math applies to any number of dimensions but since humans cannot visualize more than 3 dimensions we use this diagram.) So above we have a box with axes x,y,z, showing 3 Eigenvectors-Red, Blue and Green. You can see that they are orthogonal (at right angles) to each other, thus reducing the dimensions of the data space and producing a data space which captures the highest degree of variance, that is the essence of the data. Now, Eigenvectors only show the direction of the vector. They length of the vectors is the Eigenvalue.Eigenvalues tell you how much the data spreads out along each axis (how important each direction is). So, PCA helps you find the most meaningful directions in your data, and you can use fewer axes to describe most of the data's variation.
From this, we go on to the concept of using Eigenvalues to measure the stability of a system. Let's take the financial markets for example. If I were to plot on a chart the 30-day rolling Eigenvalue of a financial aset, the high Eigenvalues would indicate periods of high instability in the system.
The largest eigenvalue in a rolling window of a correlation or covariance matrix is a powerful indicator of market structure and stability. Here’s why a high eigenvalue signals instability:
The eigenvalues of a correlation or covariance matrix measure how much of the total variance (or “movement”) in the system is explained by each principal component (a kind of “hidden factor” driving the data). The largest eigenvalue tells us how much of the system’s behavior is being driven by a single dominant factor.
When markets are stable, risk and returns are spread out across many factors—no single factor dominates, so the largest eigenvalue is relatively low.
When instability or crisis hits, assets start moving together (correlations rise), and a single factor (like panic, liquidity crunch, or a macro shock) explains much more of the total movement. This causes the largest eigenvalue to spike.
In summary:
Low largest eigenvalue → risk is diversified, markets are stable.
High largest eigenvalue → risk is concentrated, markets are unstable, and a single force is driving most of the action.
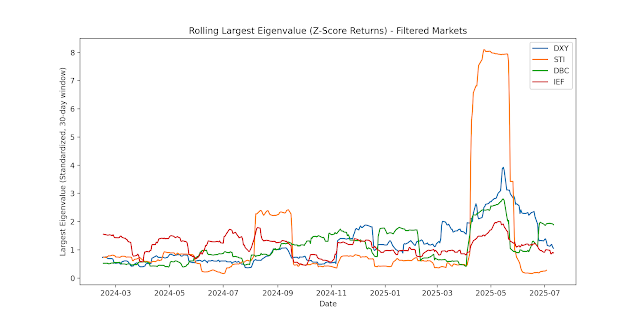
Here is a chart of the 30-day window of the returns of following financial assets: DJI is the Dow Jones Industrial Average, SSE is the Shanghai Stock Exchange Index, BSE Sensex is the Bombay Stock Exchange Index, DRB is the Invesco Commodity Index, GLD is the SPDR Gold ETF, IEF is the 7-10 years Treasuries Price ETF. Note that because of differences in scale we have standardized the returns with a Z-Score.
You can see that equity markets have the highest instability. (DJI Orange), SSEC (Red), BSESN (Orange)) with the Singapore market (STI) (Purple) having the highest instability. Now this chart is messy because the assets with lower Eigenvalues are all bunched up at the bottom. We remove DJI, SSEC, BSESN and GLD to get the chart below:
The upshot of all this is that investors should not just invest in equities but diversify their portfolios to include for example, a Commodities ETF, a Currency ETF (but I do not recommend the USD) and a Bonds ETF (but not the US Treasuries)
As the markets are being roiled by Trumpian and TACO uncertainties we would have to wait till 1 Aug 2025 to have a clearer [picture.
But here is a heatmap showing the correlation between the various financial assets discussed here as of 11 Jul 2025: In general you can see that there is very little correlation whether positive or negative except for Gold and Commodities with a correlation of 0.40. And this indicates that investors are hedging against Inflation. But I think we will have both Inflation and Recession. The worst kind of situation that can befall an economy! Goodbye to America.


Comments
Post a Comment